
EU commercial catches continue to decline, but value increases
EU fishing vessels caught approximately 3.4 million tonnes (live weight) of fish and shellfish in 2022, with the annual total representing a new low for the industry, putting it well below 2017’s and 2018’s 4.6 million tonnes and much lower still than the 5.9 million tonnes caught in 2001, finds new estimates from the European Commission’s Eurostat office.
The fishing fleets of Spain, France, Denmark and the Netherlands accounted for about half the total volume caught by EU member states in 2022. Catch levels were further down in Denmark; the reduction in catches between 2021 and 2022 was 7,770 tonnes (the equivalent of a 1.7% drop) and relatively unchanged level in Spain (+0.1%). These developments were in contrast to the increase in France (+7.0%, or 33,600 tonnes).
Catch levels in 2022 were also lower than 2021 in many other member states, not least Poland (down 26,600 tonnes), Sweden (-14,300 tonnes), Italy (-12,800 tonnes), Lithuania (-12,600 tonnes) and Finland (-8,900 tonnes).
Apart from France, there were also notably higher catch levels in Greece (up 6,800 tonnes) and Germany (+4,700 tonnes).
About 70% of all EU catches in the seven marine areas covered by EU statistical regulations were taken in the Northeast Atlantic area, with the key species caught in 2022 being herring (19% of the live weight), sprats (14%), blue whiting (11%) and mackerel (10%).
About one tenth of the total EU catch was taken in the Mediterranean and Black Sea, where the main species caught were sardines (22% of the EU catch in the area) and anchovies (18%). Two fifths of the total EU catch in this area was by the Italian fleet (36.3%), with the fleets of Greece (18.8%), Croatia (18.2%) and Spain (17.7%) together accounting for the vast majority of the rest.
About 7% of the total EU catch was taken in the Eastern Central Atlantic, where the main catches were mackerel and yellowfin tuna. Among member states, Spain (about 37%), Latvia (16%), Lithuania (15%), and the Netherlands (12%) accounted for the vast majority of catches in the area.
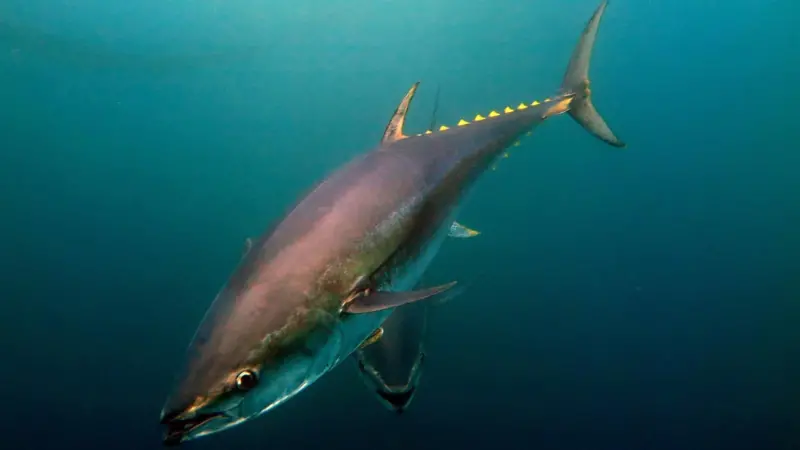
Some 7% of the total EU catch was taken in the Indian Ocean, Western area, where the main catch was tuna, particularly skipjack, yellowfin and bigeye tuna. About two thirds of the EU catch in the area was by Spain, and most of the rest by France.
Only 6% of the total EU catch was taken in three remaining marine areas. The main species caught in these areas were the following: hake in the Southwest Atlantic; blue sharks and skipjack tuna in the Southeast Atlantic, and redfish, cod and halibut in the Northwest Atlantic area.
Eurostat estimates some 3.2 million tonnes of fisheries products were landed by EU vessels in the EU in 2022, representing no change from the volume landed in 2021.
Spain accounted for about one fifth (700,000 tonnes) of the EU landings in 2021, Denmark another one fifth 600,000 tonnes) and the Netherlands about 16% (500,000 tonnes).
Among the member states for which 2022 data was available, the quantity of landings was down considerably in Germany (27,000 tonnes less than 2021, the equivalent of a 42% reduction), Denmark (27,000 tonnes less, or -4.1%) and in Finland (15,500 tonnes less, or -20%). By contrast, landings were much higher in 2022 in France (up 27,500 tonnes, or +9.6%) and Netherlands (16,400 tonnes, or +3.3%).
The estimated fall in the quantity of total fishery products landed was accompanied by a rise in the value – from an estimated €5.9 billion in 2021 to €6.2 billion in 2022.
The value of the fish landed in Spain was higher than in any other member state, reflecting the high value attached to its landings of species like tuna, hake, swordfish, squid and pilchards. The value of landings in Spain was up 15.1% to €2 billion in 2022, after rising 10.8% in 2021.
Landings values also rose sharply in France (a provisional +18.5% to €1 billion in 2022) and Denmark (+7.7% to €500 million). This contrasted with declines in the value of landings in other countries, including the Netherlands (-20.1% to €500 million) and Ireland (-18.2% to €400 million).
Eurostat’s data also determined the EU fishing fleet continues to shrink. The number of active vessels in the bloc was 7,595 in 2022. These vessels had a combined capacity of 1.3 million gross tonnes and a total engine power of 5.3 million kilowatts (kW). In the decade between 2013 and 2022, the number of vessels in the EU declined by an estimated 11%, the overall gross tonnage fell by 9% and engine power was also down 9%.
The EU fleet also remains very diverse, with the vast majority of boats being no more than 10 metres long, and a small number of vessels exceeding 40 metres in length. The average size of an EU fishing boat in 2022 was 18.5 gross tonnes and the average engine power was 73.4 kW.
When measured by gross tonnage, Spain had, by far, the largest fishing fleet among member states (23.7% of the EU total), followed by France (13.1%) and Italy (10.9%). However, when measured by engine power, the largest fleet was that in France (18% of the EU total), followed by Italy (17.8%) and Spain (14.2%).
In terms of vessel numbers, the largest fleet in the EU was in Greece (17.8% of all vessels), followed by Italy (16.9%) and Spain (11.9%). Greek vessels were generally small, with an average size of 5 gross tonnes, and an average engine power of 29.6 kW in 2022.
By way of comparison, the overall holding capacity of the Norwegian fishing fleet was the largest in Europe (460,000 tonnes in 2022, which was 21.5% more than in 2013). It was also considerably more powerful than the EU average, with an average 249.9 kW per vessel. At the same time, the 1,540 fishing vessels of Iceland in 2022 were also much larger and more powerful than the EU average, with an average holding capacity of 105.8 gross tonnage per vessel and 294 kW per vessel.
Meanwhile, an estimated 160,000 people were employed in the EU’s primary fisheries industry in 2021, of which about one-third were in the aquaculture subsector. About one-quarter of employment in the primary fisheries industry of the EU in 2021 was in Spain. Indeed, three quarters of EU employment in the industry was concentrated in just Spain, Italy, Greece, France and Portugal.
Italy, Greece and Portugal accounted for much higher proportions of employment in the EU fisheries industry than of fisheries production; together they accounted for about 37% of EU employment in the industry, but only produced about 15% of production. Conversely, Denmark and the Netherlands had relatively low employment in fisheries (1% to 2% respectively of the EU total) but much higher shares of fisheries production (about 11% and 7% respectively). These contrasts highlight the differences between the fishing industries of some countries with a relatively large number of small vessels and others with a relatively small number of large vessels.
Fisheries statistics are collected by Eurostat from official national sources for the EU member states and members of the European Economic Area (EEA).